

Reducing waste and material use
 How do we reduce the wastes and materials we use to ensure wise use of the earth’s limited resources? Lha conducts a monthly mass waste clean-up around McLeod Ganj (refer Contact magazine monthly reports) At Lha’s waste clean-up on 21 October 2017 a lot of solid waste was collected, much from roadside drains, culverts and embankments. Some was old and some new. New was post-Dewali fireworks residue, celebration bottles and junk food wrappers. No liquid wastes were collected. Some waste was not very accessible. For example, it was on private land, behind fences, in nettles, down steep slopes. Waste collectors wore everything from full hiking gear to relaxation clothes (see Lha facebook photos).
The waste clean-up was an opportunity for community engagement. Lha staff, volunteers and students cleaned-up and then had a celebratory lunch. Broader community engagement was limited. Smocks offered some marketing but encouraged little involvement. And Clean Up Dharamshala Programme (CUDP), the local waste contractor, did not have empty waste bins available.
Lha’s mass clean-up represents an important part of local waste management. What about its broader role in reducing material and waste use.
The worldwide rise, spread and inequity of consumption impacts materials (Worldwatch Institute, Consumption)

Figure 1 Water stress by country in 2013 (WRI Aquaduct. Gassert et al., 2013)
For example, in our area, India’s water stress in 2013 was higher than China’s. 40-80% of agricultural, domestic, and industrial users is withdrawn annually, rather than 20% – 40%. Tibet and Himachal Pradesh would be less stressed because of smaller populations drawing on large Himalayan water resources.
Indeed, many materials are reaching unsustainable levels. Refer to the example of Phosphorous (Peak phosphorous and implications for India). So, we need to use materials wisely. Otherwise they may disappear.
Many materials that we use are then wasted. Developed countries generate the most waste by weight per person; and China more than India (Which countries produce the most waste, World Economic Forum, August 2012). What happens to that waste?
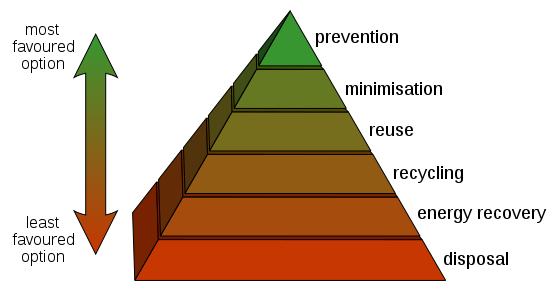
Figure 2: Diagram of different levels of waste/material (Waste Hierarchy, Wikipedia)
A good way of considering waste and material use is this waste diagram. It is a little more helpful than the mantra: ‘Reduce’, ‘Reuse’, Recycle’ because it has 6 steps.
Prevention asks the most important question: “do you really need that material’? An example may be “Do you need to buy that gift for someone who may not use it”? Maybe giving an experience would be better or more appreciated. This is an example of designing out or planning not to use the material at all.
Figure 2: Diagram of different levels of waste/material (Waste Hierarchy, Wikipedia)
Minimisation asks how you can reduce waste or use of a material. For example, ‘how long do you need for a shower (water and energy use creating waste water and costing Rupees), or that light on (energy and Rupee cost)?
Reuse asks about multiple uses of the same materials. A ‘waste’ to one person may be a ‘resource’ to another person. Alternatively, a closed-loop system may be possible. For example, the Volkswagen plant in Pune, India is reported as reusing its wastewater (How VW plans to achieve wastewater free production, Global manufacturing, 25/8/14).
Recycling asks to reuse the basic materials. For example, plastic or glass water bottles may be recycled so that the plastic and glass can be reused. This would take more energy than ‘reuse’.
Energy recovery may be seen as a form of recycling focussed on energy from waste. The current status for large-scale waste to energy plants in India is poor according to this analysis (Energy Recovery from Waste, Science Direct, Vol 21, June 2017)
Disposal is usually in a bin, collected by a waste contractor and taken to landfill. For example, CUDP is the waste contractor for 3 Dharamsala wards including McLeod Ganj. Waste management was also recently noted in Tibet and in Amritsar.
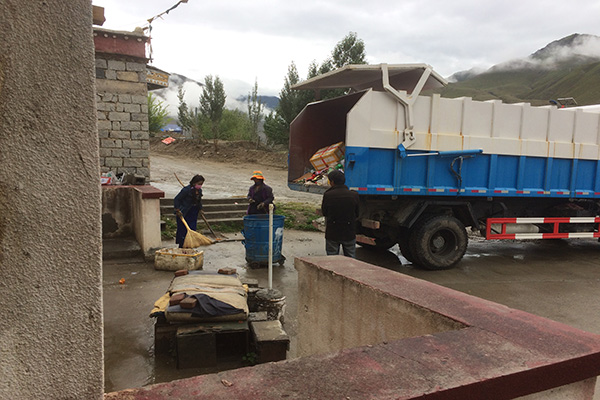
(pic 1: Tibet waste truck, Shigatse, August 2017)
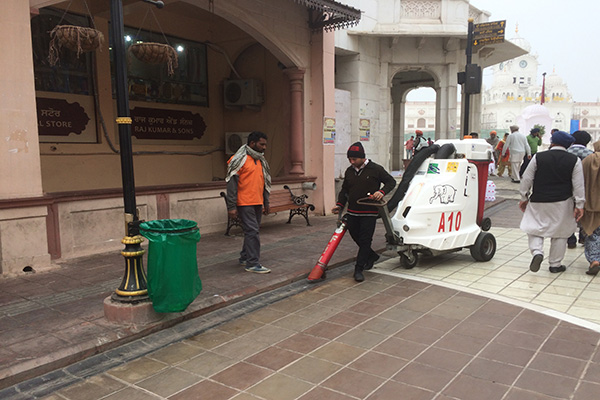
(pic 2: waste bin and sweeper, Amritsar, November 2017)
Littering is not shown in the diagram. It is not thoughtful disposal. Not everyone uses bins. CUDP employs 15 sweepers to clean the streets. And Lha conducts its supplementary monthly mass clean-up (refer Lha Facebook photos).
The waste/resources diagram was accepted in developed countries such as the European Union in 1975 and its use was made legal in 2008 (EU Waste Framework Directive 2008/98/C). However, developed countries produce more waste, so it is needed more.
In Tibet and Himachal Pradesh there is no evidence that this diagram is used much. Evidence in McLeod Ganj is that most waste is either litter or disposed of. Some is reported as segregated (pers comm. Sonam, CUDP, October 2017) . Climbing the diagram to higher greener levels are great opportunities for us all.
Lha has been supporting CUDP’s waste management initiatives in McLeod Ganj. Mass clean-ups manage some littering and dispose of it correctly for CUDP pickup.
As Geshe Lakdor has recently stated in a teaching: “If we run after material objects, then sooner or later we will run out of these objects and we will have depleted our world’s resources. For the same reason, you cannot have eternal growth of GDP. But internal resources never reach a limit, therefore we should strive to gather more internal resources” (Paraphrased from Geshe Lakhdor’s teaching 17/10/17 on ’37 Practices of the Bodhisattvas’, Quoting HHDL). Use of internal resources, rather than external resources is an example of waste and materials prevention.
Lha and CUDP cannot advocate higher waste / material diagram levels without better participation from the people in McLeod Ganj and surrounds. Lha is planning awareness improvements. One is to join the Clean Up the World program. Another is to encourage school children to change their behaviour and their parents’. This article, too, is intended as awareness-raising.
Your thoughts and actions on reducing waste and material use are invited.
Simon Cavendish, Marvin Westerveld and Amelia Rozelle
(Simon has tried to practice the waste diagram most of the last 30 years. For example, I persuaded the largest miner/construction company in Australia to provide a contract service rather than materials / wastes – similar to Geshe Lakdor’s advice)
References
Previous Contact magazine and Facebook reports and photos on Lha mass clean-up
Worldwatch Institute, State of consumption
World Resources Institute, Water Stress
Peak phosphorous and the implications for India, Science Nordic, 8/9/14
Which countries produce the most waste, World Economic Forum, August 2012
How VW plans to achieve wastewater free production, Global manufacturing, 25/8/14)
Energy Recovery from Waste, Science Direct, Vol 21, June 2017)
EU Waste Framework Directive 2008/98/C
Geshe Lakdor, Director, Tibetan Library of Tibetan Works & Archives, Gangchen Kyishong, Dharamshala on ’37 Practices of the Bodhisattvas’, 17/10/17, Quoting HHDL
In my opinion the best way to reduce waste materials is these factories and manufacturers should determine their products lifecycle because it is normal all products after being consumed or used they end up in the landfill.